Home / Services / Data Analytics & Business Intelligence
DATA ANALYTICS & BUSINESS INTELLIGENCE

Make your business data easier
to understand and use.

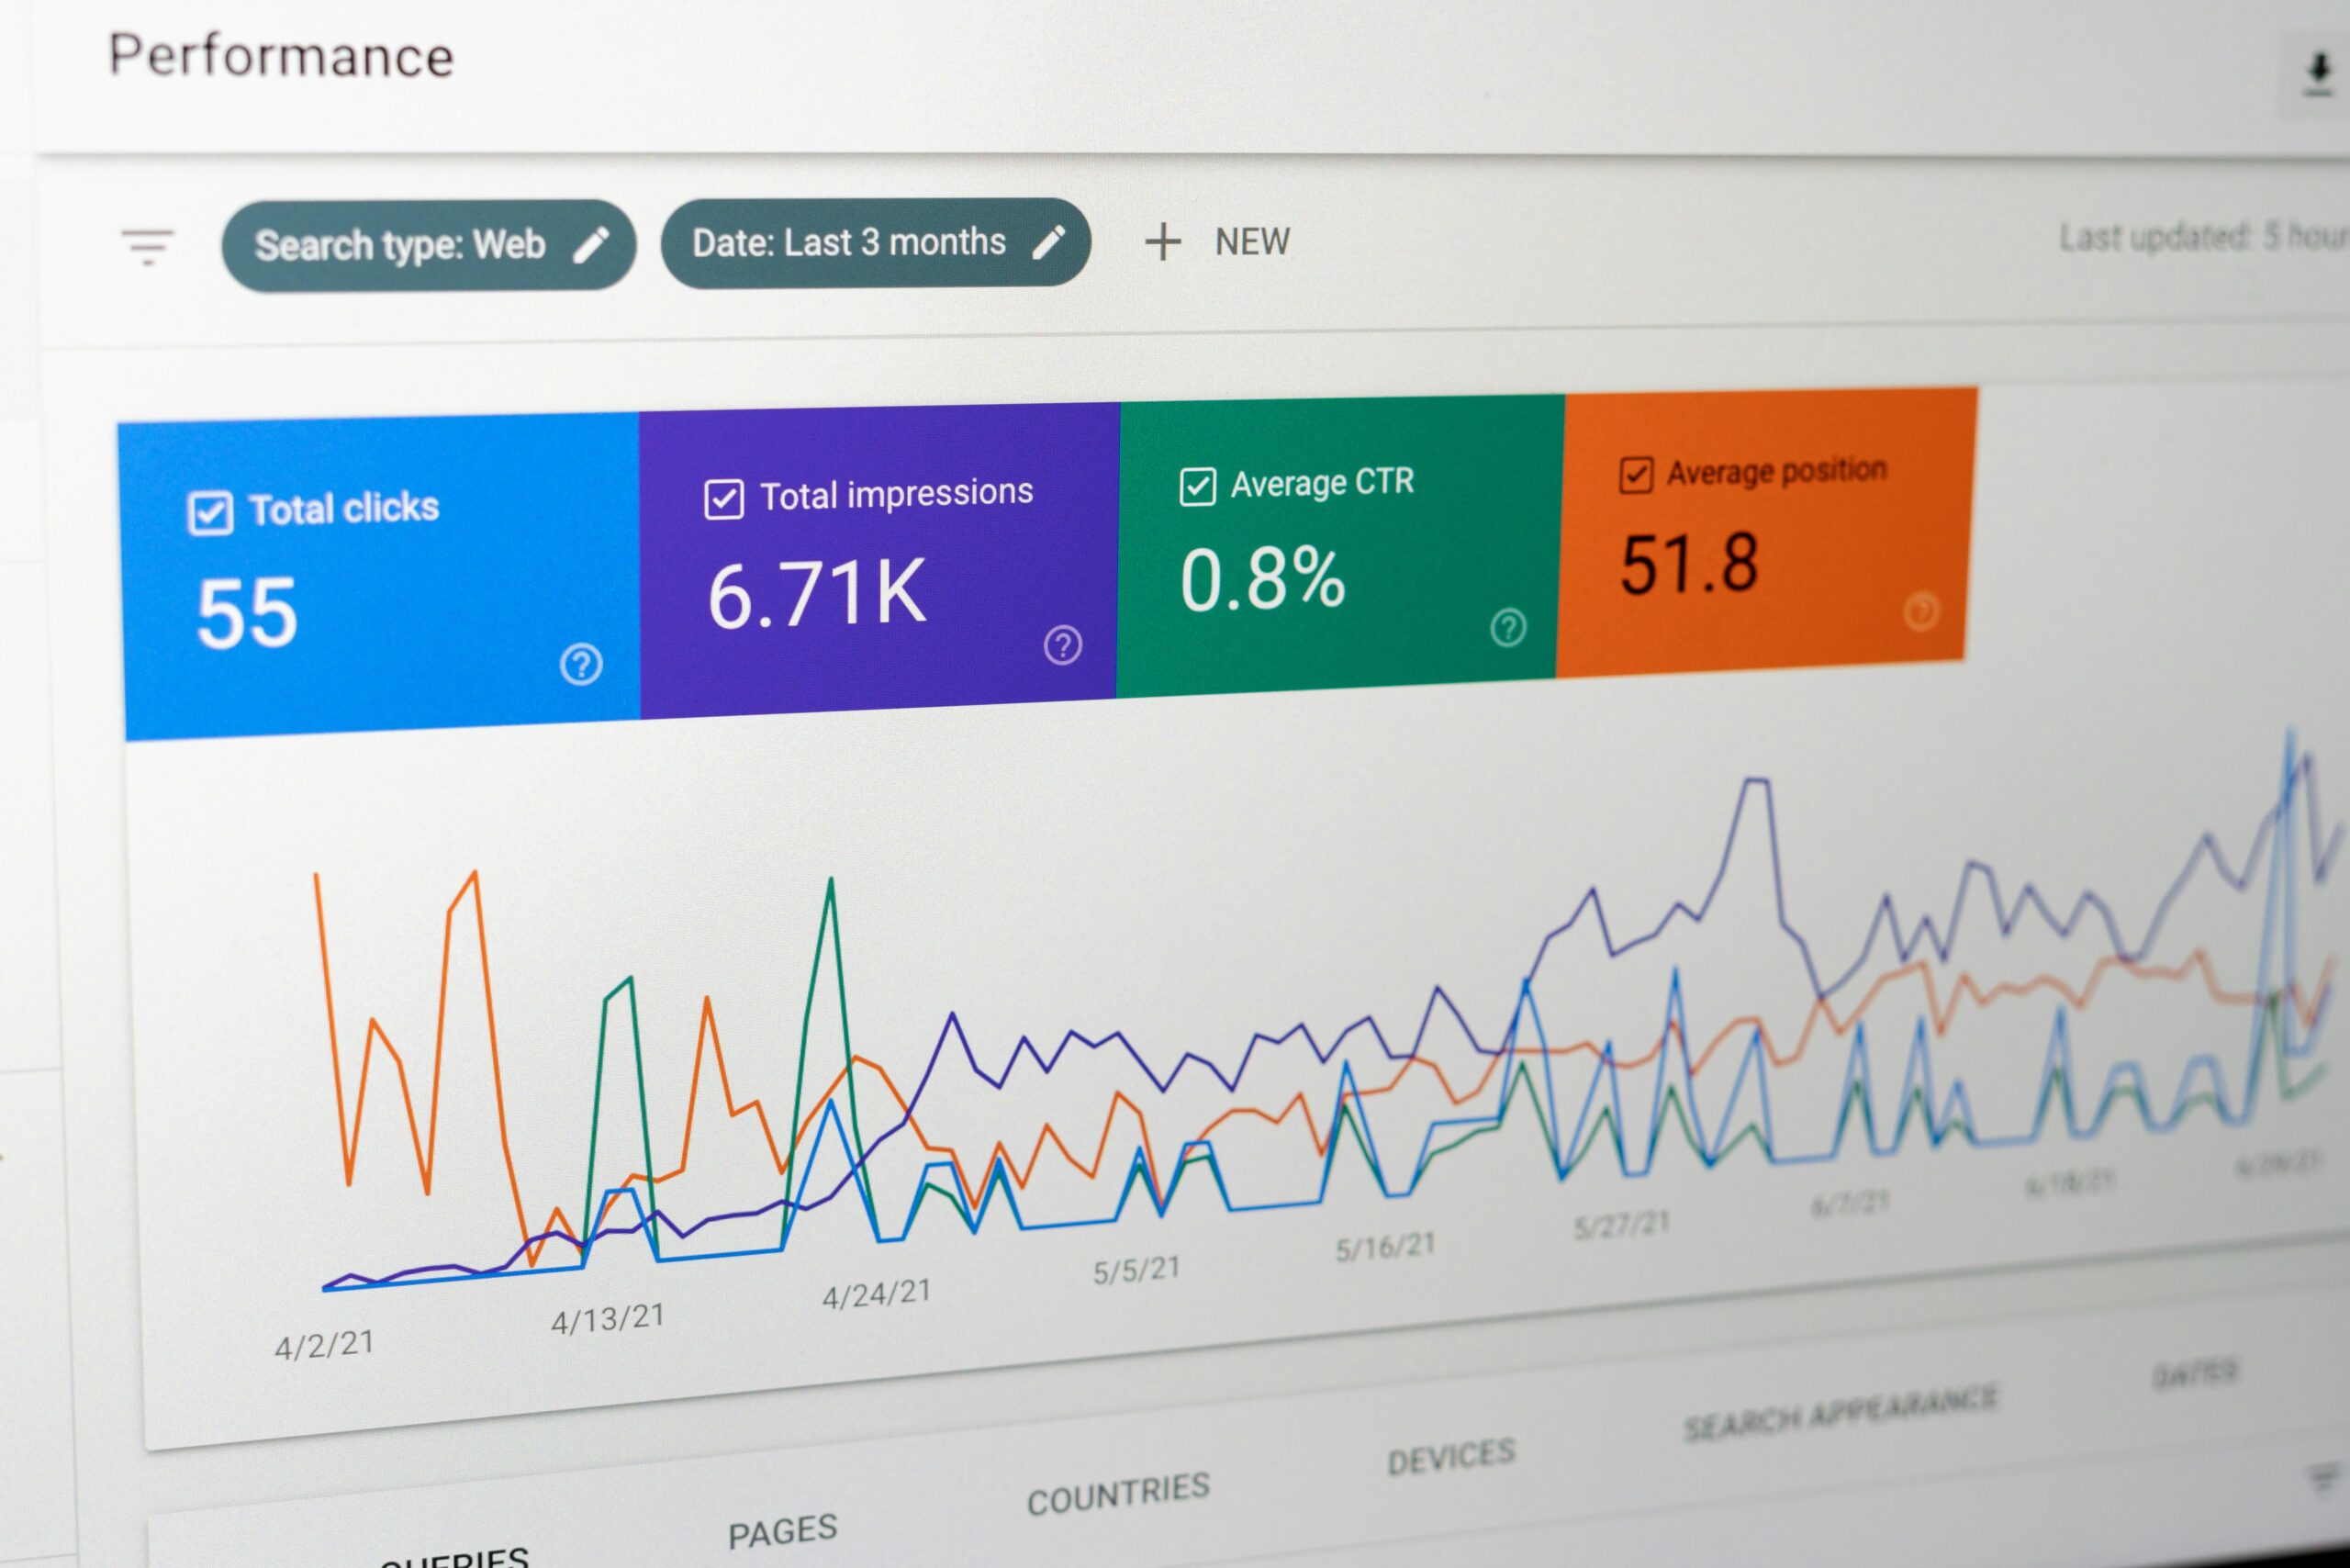
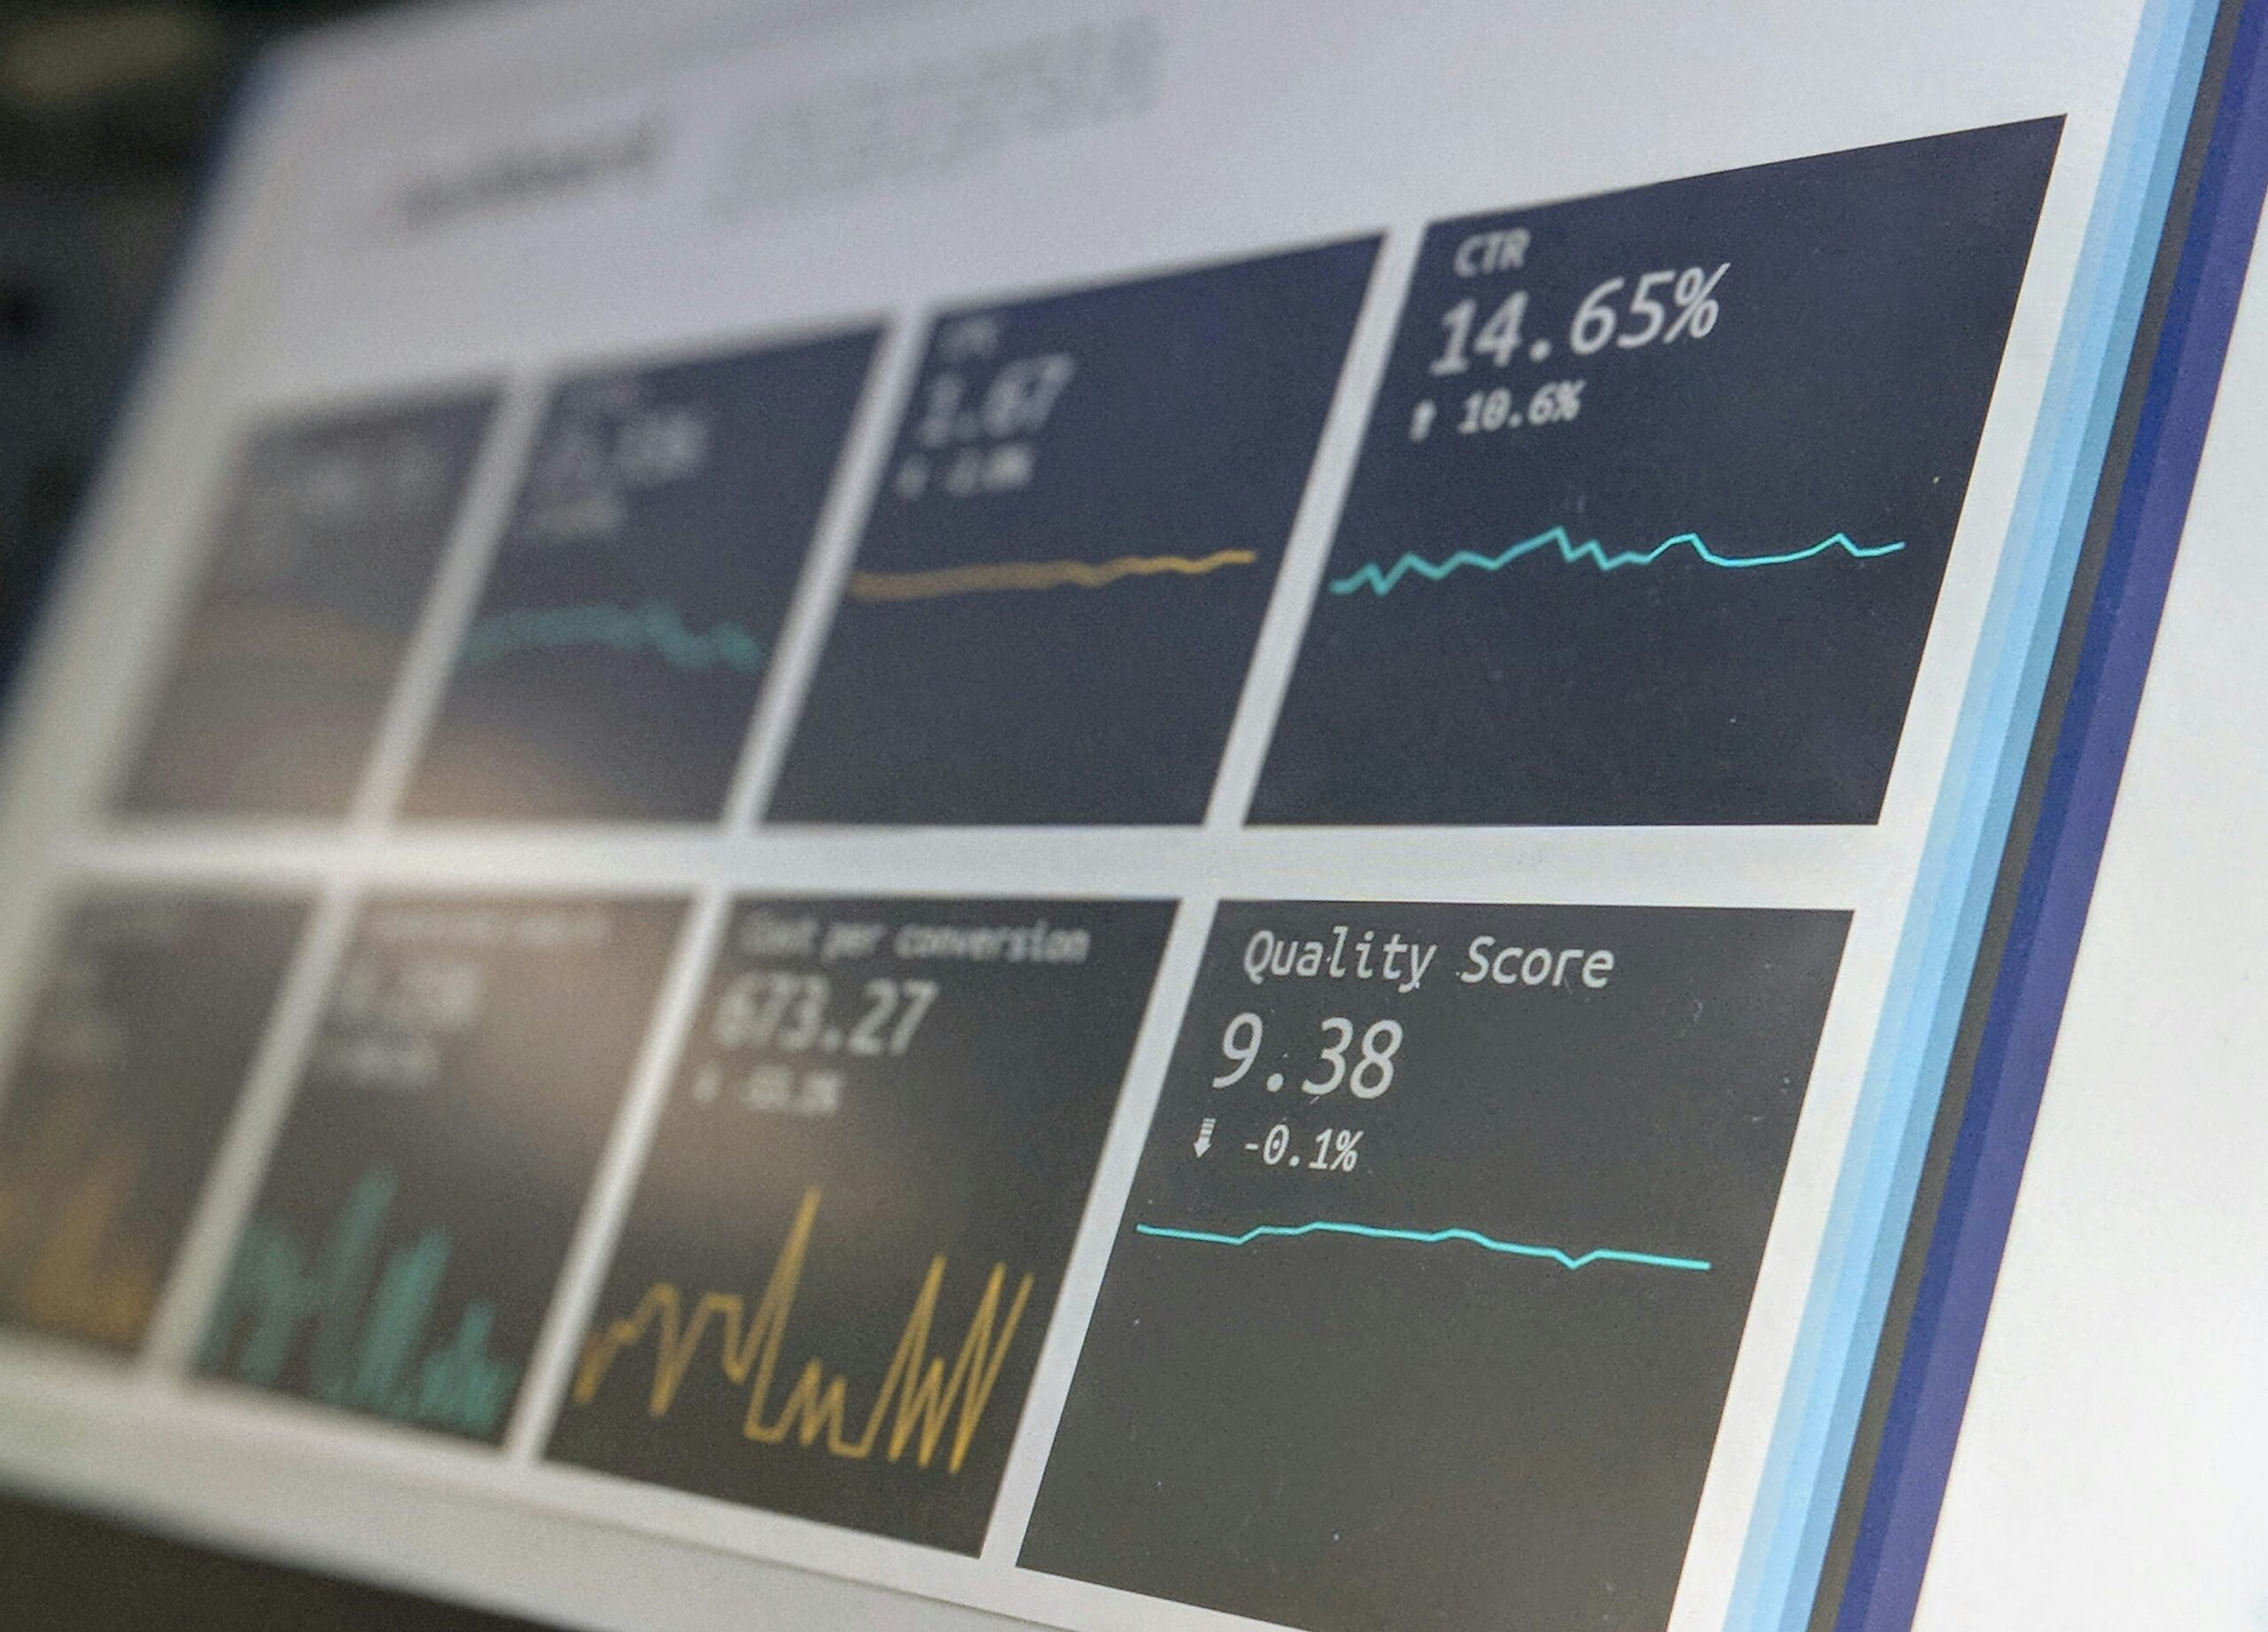
IQC Solutions® helps businesses bring data from different systems into clearer reports, dashboards and analytics workflows. From connecting data sources to visualizing performance and automating recurring reports, we build solutions around the questions your team needs to answer.
Whether your data sits in spreadsheets, business software, websites or databases, we start by understanding what you need to measure, where the information lives and how it should support decisions.
Illustrative flow: Sources → integration → validation → dashboard
Data analytics & BI overview

Data analytics and business
intelligence solutions
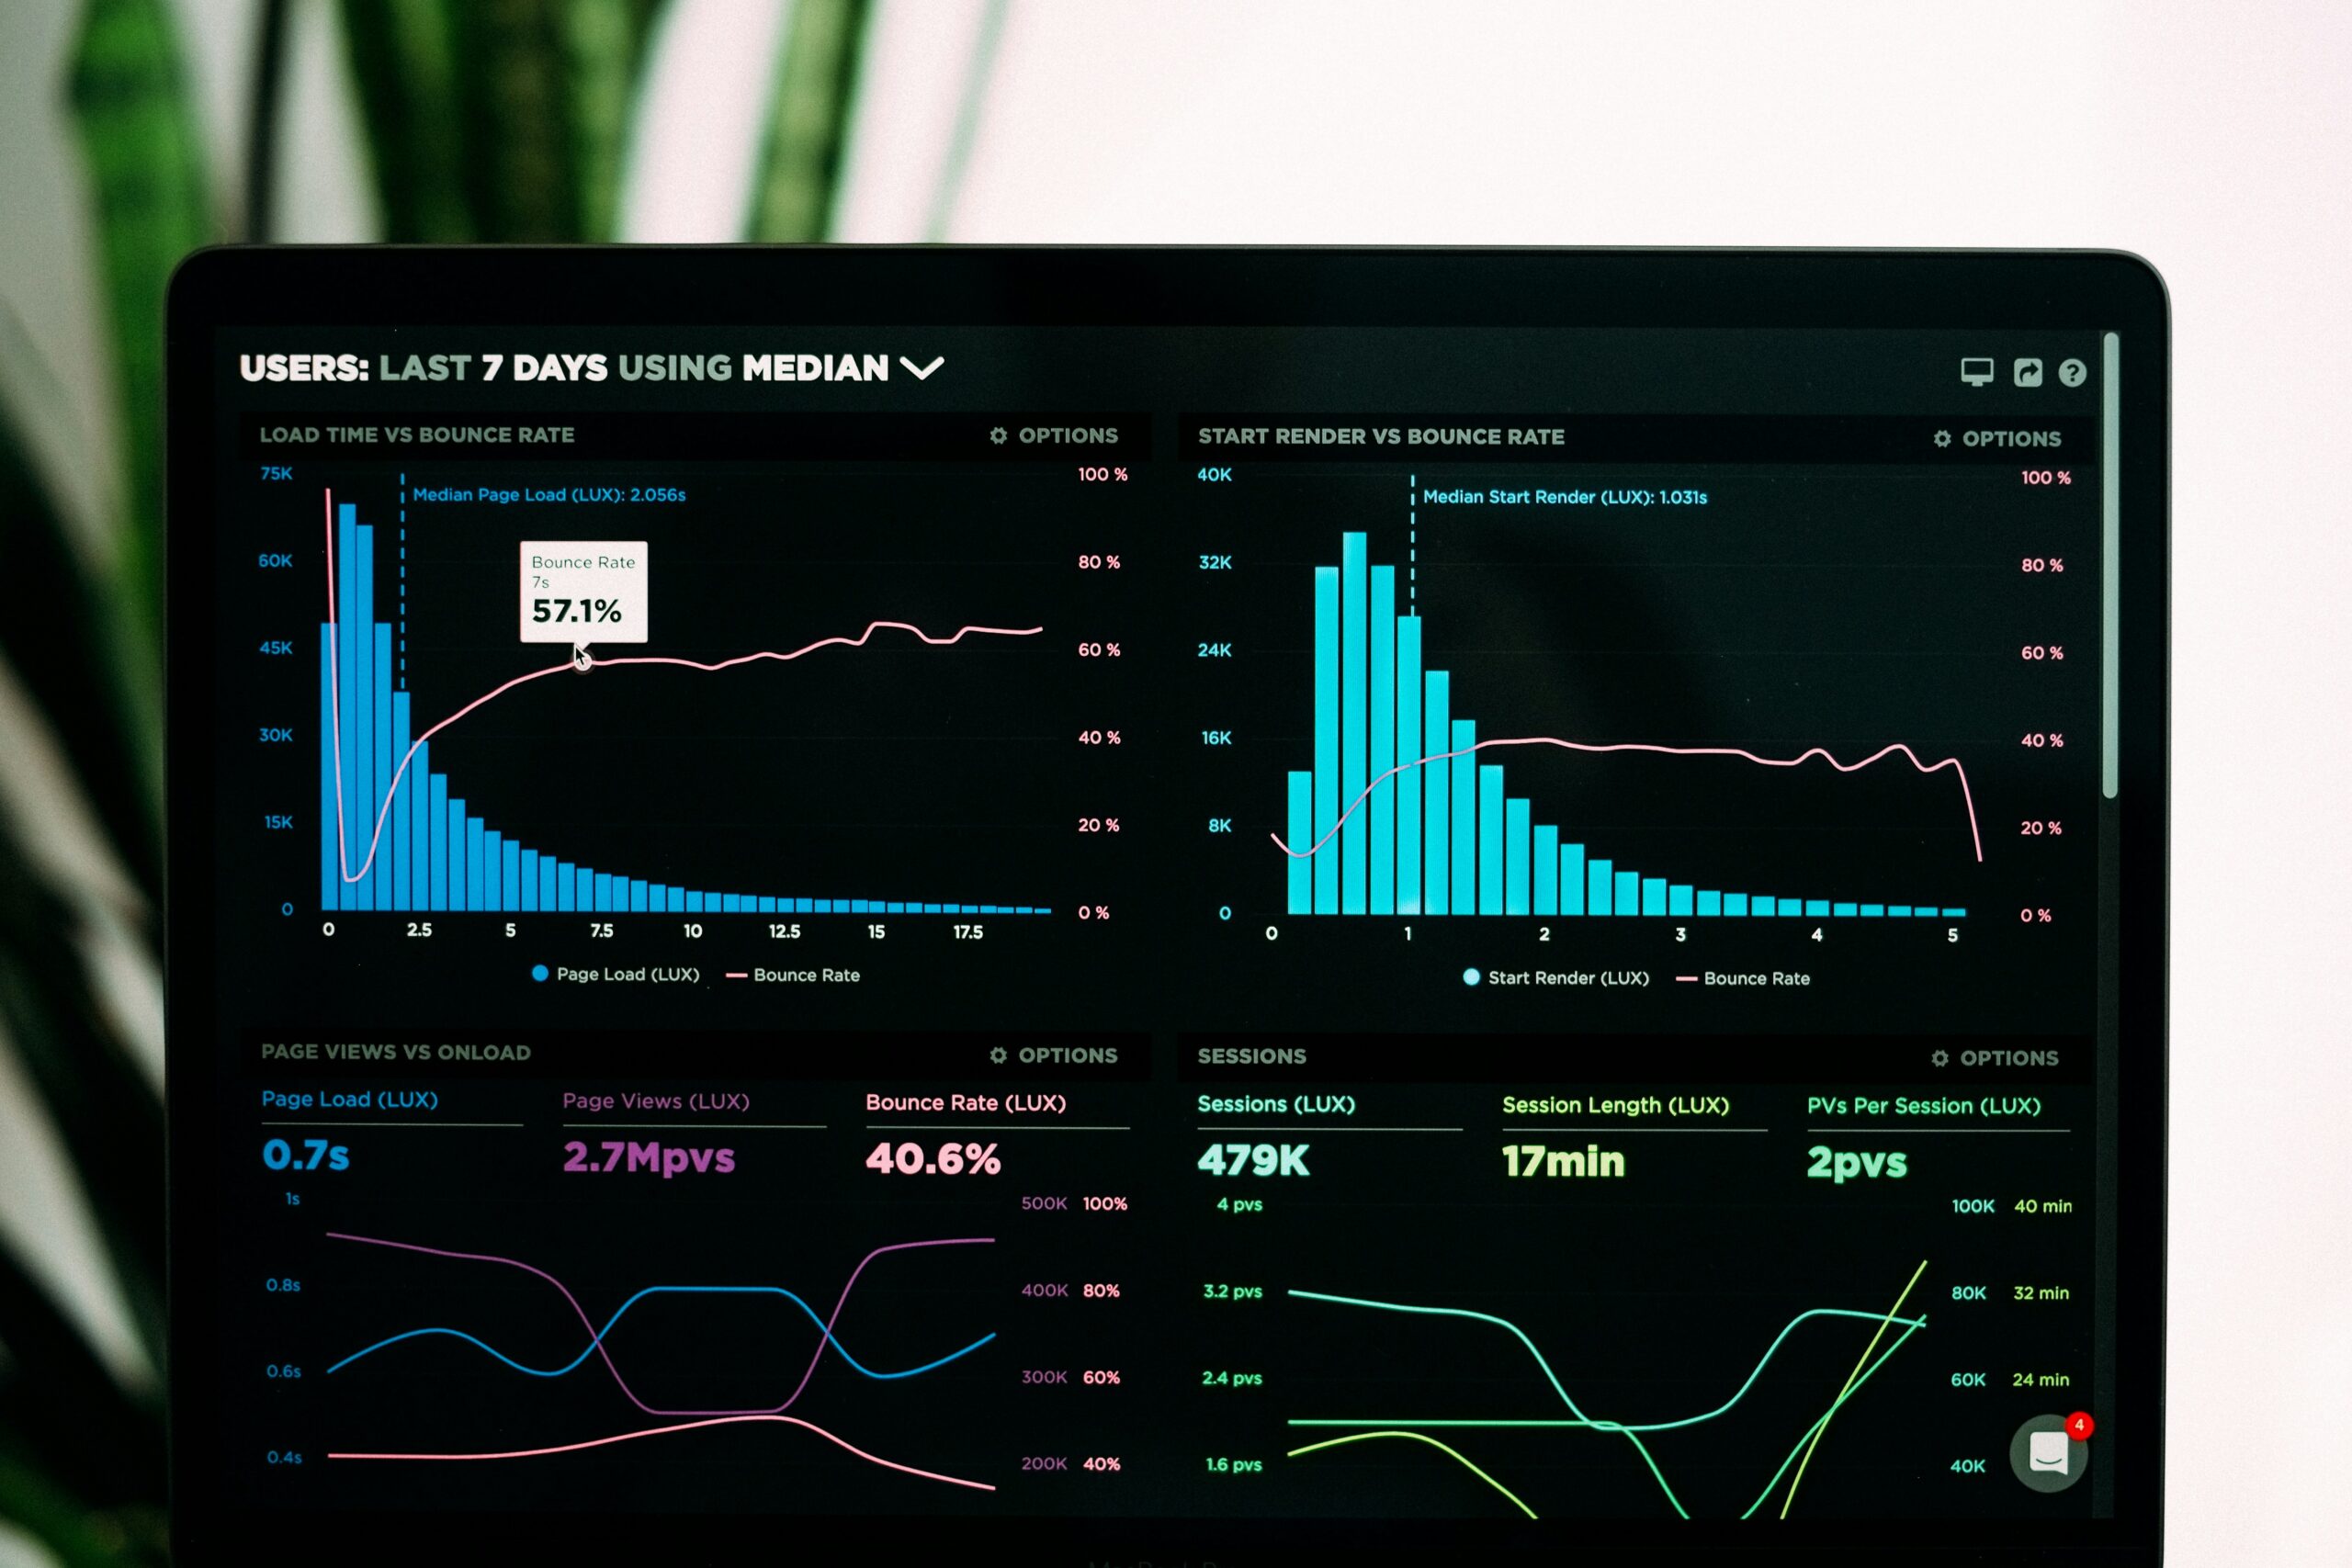
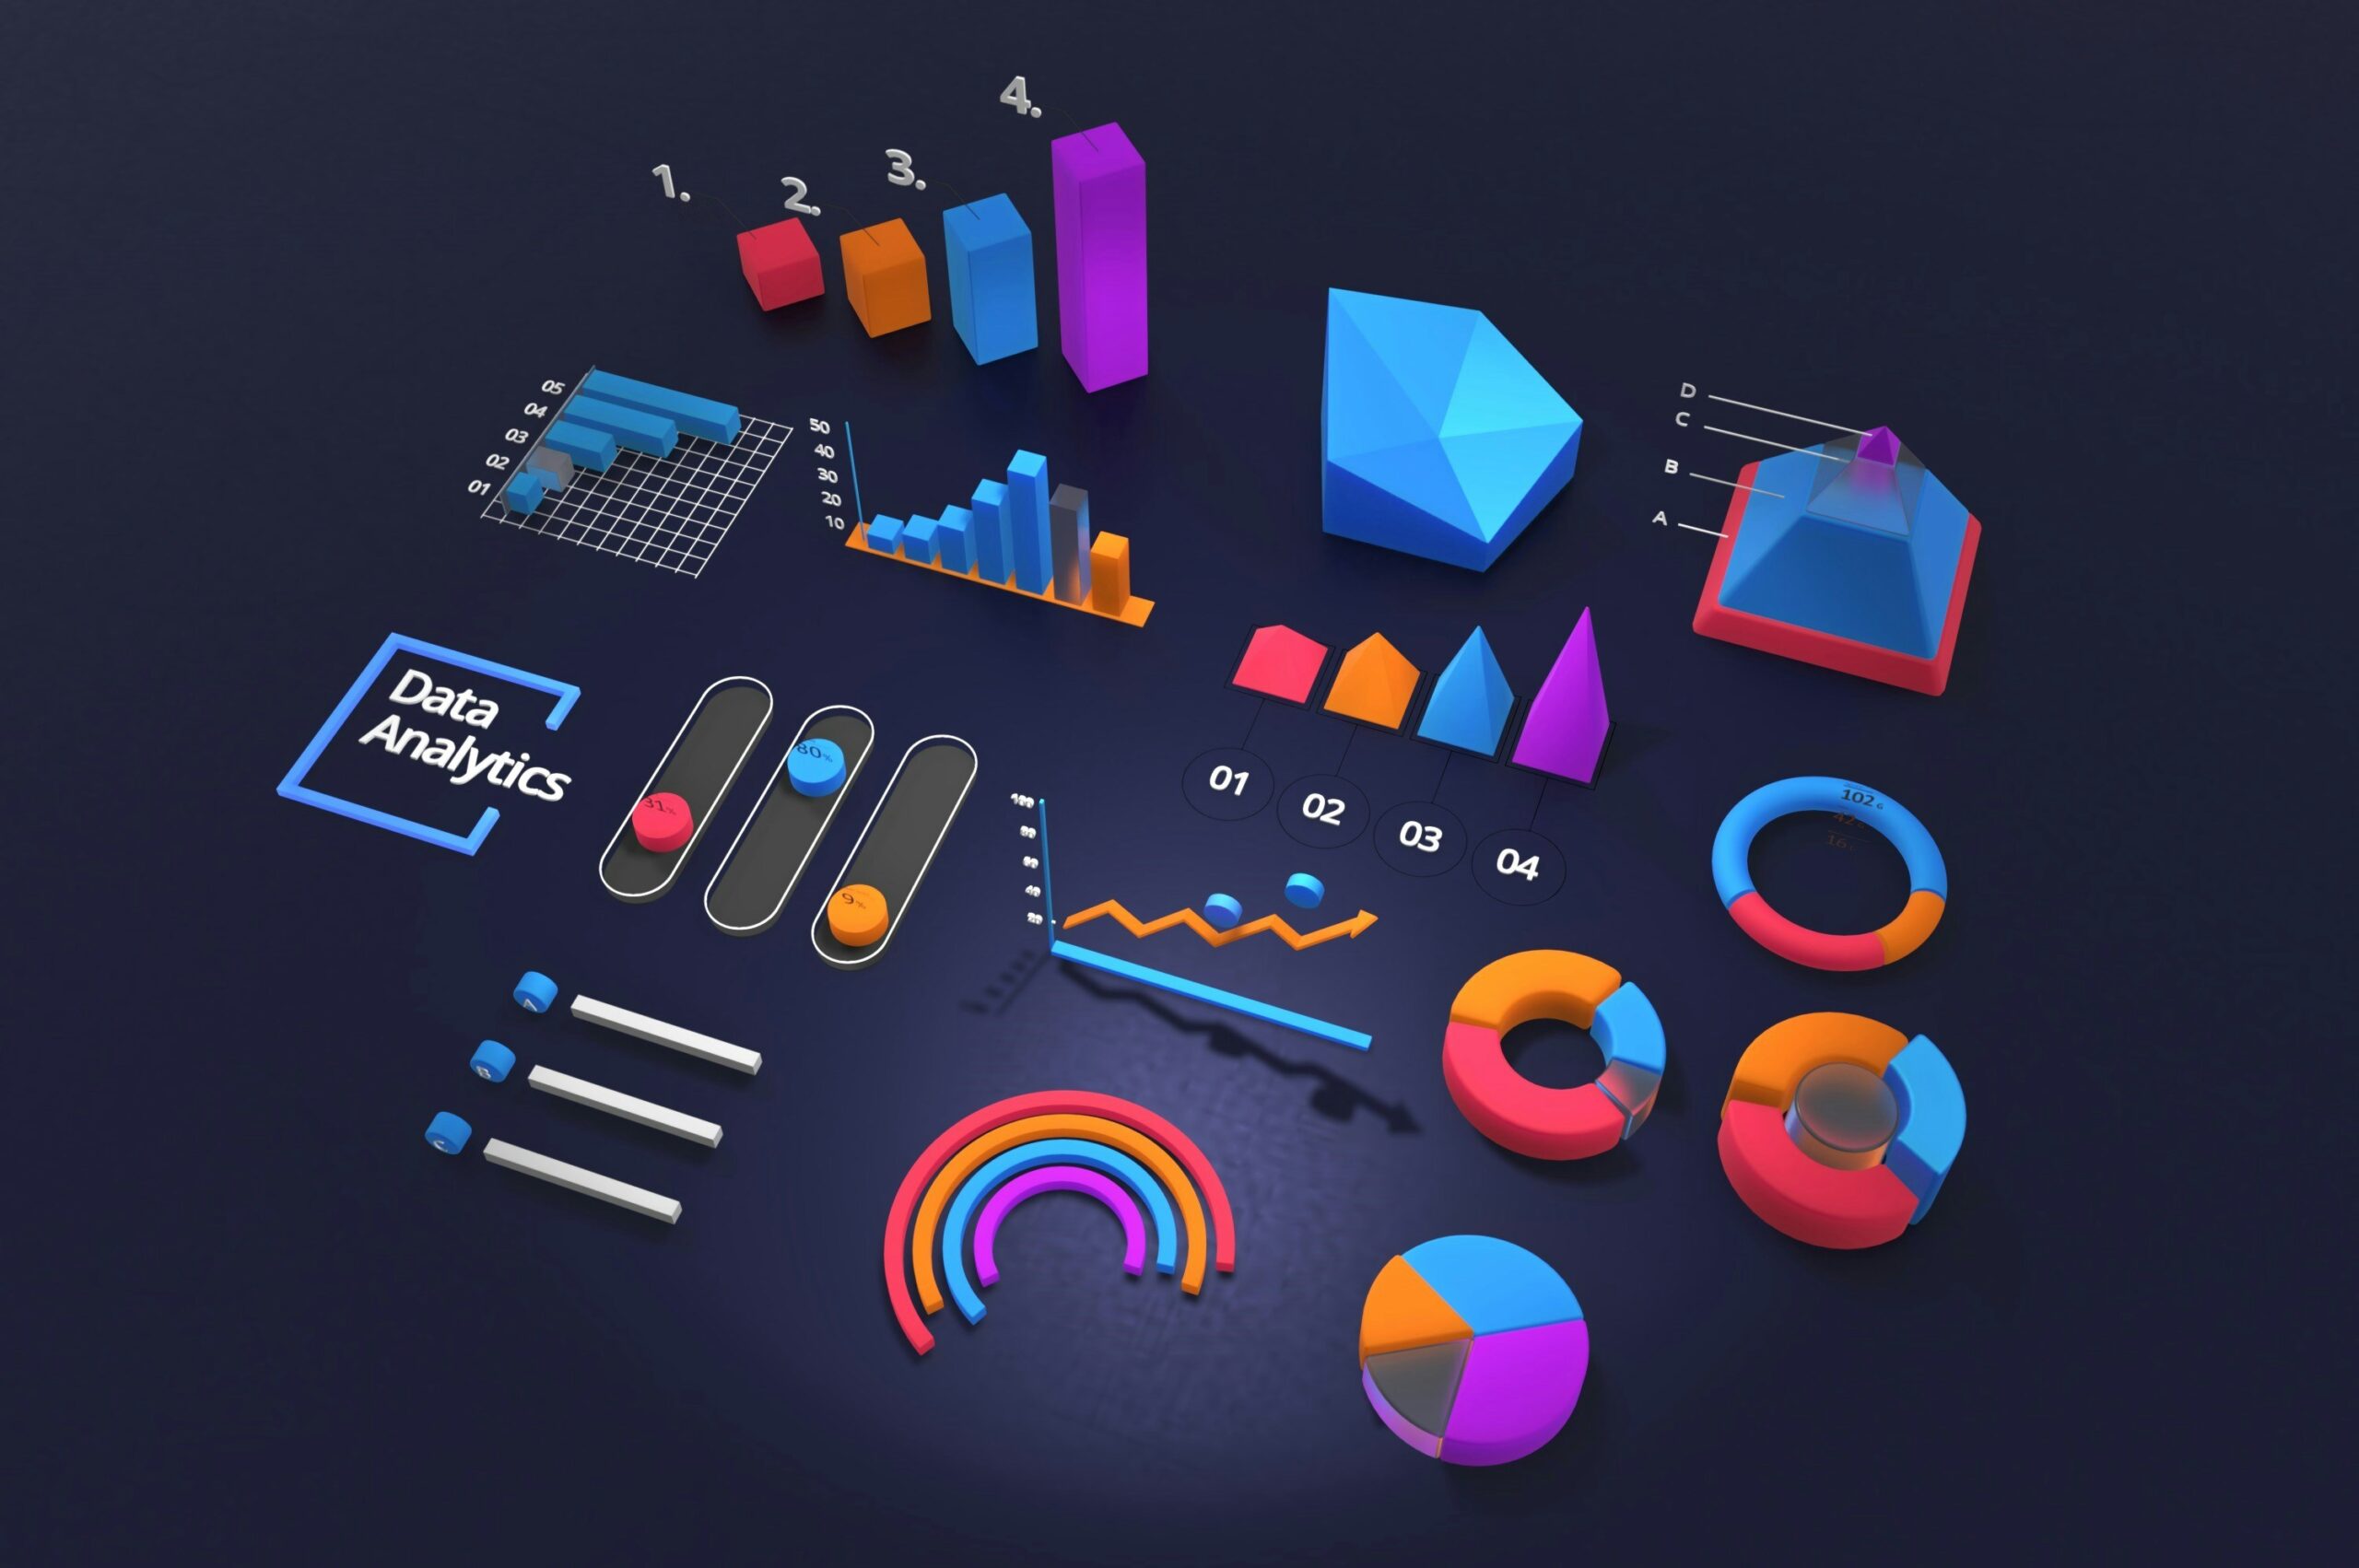
Useful analytics begins with the business question, not the chart. We can help define the measures that matter, bring the necessary data together and present it in a format teams can understand and use. The right combination depends on your systems, available data and business priorities.
01

Data Analytics

Explore business data to understand trends, performance and opportunities.
02

Business Intelligence

Bring agreed metrics into structured reporting and decision-making views.
03

BI Dashboards

Build dashboards around the KPIs and questions your teams monitor.
04

Reporting Automation

Reduce repetitive report preparation with defined workflows and checks.
05

Data Integration

Connect data from approved sources into a usable reporting flow.
06

Data Quality & Management

Keep data usable, consistent and validated across teams.
Explore the analytics capabilities below.
Data Analytics

Data analytics for business performance

Data analytics helps teams explore what is happening in the business, where patterns appear and which questions deserve a closer look. We help organize relevant datasets, define useful measures and examine trends across business activity. The work ends with a clear explanation of what the data can and cannot show, with practical next steps. Findings depend on the quality, completeness and context of the data.
Business Intelligence

Reporting shaped around the decisions your team makes

Business intelligence brings important measures from business systems into structured reports and dashboards. It can help teams work from clearer definitions of revenue, pipeline, costs, customer activity or delivery performance. We help define reporting requirements, connect relevant sources and build views that support regular reviews, not a dashboard full of metrics no one uses.
BI Dashboard Development

Custom dashboards for the right people

A useful dashboard gives the right people a timely view of the measures they need to monitor. We design dashboards around roles, business goals and source data, from executive summaries to sales, operations or marketing views. We define each metric, establish where it comes from, design the experience and validate the data before release. Refresh frequency, permissions and drill-down are planned around your actual systems.
Reporting Automation

Stop rebuilding the same report every week

Recurring reports often mean collecting exports, cleaning spreadsheets, reconciling values and rebuilding the same presentation each week or month. Reporting automation can reduce those steps by scheduling data pulls, applying defined transformations and delivering reports in an agreed format. We assess what suits automation, where human review is still needed and how exceptions are handled when a source changes or fails.
Data Integration

Connect the systems your reports depend on

When information is split across business software, spreadsheets, websites and databases, teams spend more time reconciling data than using it. Data integration connects the sources needed for a report or analytics workflow and defines how records are mapped and updated. Feasibility depends on access permissions, source-system limits, data structure, licenses and update frequency.
Predictive Analytics

Forecasting, with realistic expectations

Predictive analytics uses historical data and relevant variables to estimate possible future outcomes, such as demand planning, sales forecasting or workload estimates. Forecasts are estimates, not guarantees. We first assess data coverage, stability, seasonality, bias and the cost of incorrect predictions, then agree how the model will be tested and monitored.
Reporting & data foundations

Clear visuals on top of
dependable data

Reports are only as useful as the information behind them. These capabilities make the data and its presentation easier to trust.

Data Visualization

Choose chart types, organize information and set clear labels so people can interpret the message without decoding the graphic.

Business Reporting

Reports for sales, finance, marketing, operations or management, delivered as dashboards, scheduled summaries or documents, with metric calculations clarified.

Data Management

Map data sources and ownership, document key fields and establish consistent structures and maintenance workflows.

Data Quality & Validation

Document validation rules, compare totals, track issues and make duplicates, gaps and inconsistencies visible.

Data Automation

Automate collection, transformation, checks and distribution, with exceptions surfaced rather than silently passed downstream.

Custom Analytics Solutions

Map the decision, the users, the sources and the constraints, then build integrations, logic and dashboards around that question.

Function-specific analytics

Reporting for the teams
that use it

Metric definitions are agreed with the responsible business owners before comparisons are made. We do not provide audit, accounting opinion or regulated financial advice unless a separately qualified service is in scope.

Sales Analytics

Leads, opportunities, conversion stages, products, accounts and revenue measures, with agreed definitions of a lead, a win and the reporting period.

Marketing Analytics

Campaign, website, advertising and CRM data in one view, with sources, conversions and attribution assumptions stated.

Customer Analytics

Engagement, repeat activity, purchasing patterns and churn indicators, respecting access controls, consent and data minimization.

Financial & Operations Analytics

Costs, budgets, delivery measures, capacity, inventory and service levels from approved source data.

Real-Time & Near-Real-Time

Choose a refresh cadence based on the decision and source systems. We state the actual interval rather than claiming real-time.

Analytics API & System Integration

Move information between analytics tools, business applications, databases and custom software, with monitoring and error handling.

Solutions by business need

Start with the question
you need to answer

If reports take too long to prepare, reporting automation may be the right start. If information is split across tools, integration may come first. If leaders cannot see agreed KPIs, a dashboard may be more useful. We help identify the smallest practical first step.

Bring data together

Connect scattered sources into one reporting flow.

Automate recurring reports

Remove manual exports and rebuilds.

Track performance

Monitor agreed KPIs in one place.

Improve forecasting

Assess whether your data supports useful estimates.

Check data quality

Surface missing, duplicate or inconsistent records.

Build a custom dashboard

Design views around your roles and decisions.

What can we analyze?

What business data can we
help you analyze?

Depending on access and data quality. The first step is to define the question and check whether the available data supports a reliable answer. Where information is missing or inconsistent, we address that before drawing conclusions.

Sales activity

Pipeline, conversion and revenue measures.

Marketing performance

Campaigns, traffic and enquiries.

Customer engagement

Activity, repeat behavior and groups.

Financial measures

Costs, budgets and trends.

Operations

Delivery, capacity and service levels.

Website activity

Visits, journeys and conversions.

Product usage

How a product or service is used.

Other business datasets

Tell us what you have and what you need to understand.

Analytics process

Our data analytics
and BI process

From the first business question to a documented solution your team can use.
01

Define the question

Agree the business decisions, measures and users the solution should support.
02

Assess the data

Identify sources, access needs, gaps and constraints.
03

Design

Structure the data and plan reports or dashboards.
04

Build & validate

Implement integrations, checks, transformations and visualizations.
05

Review with users

Compare results against known figures and refine.
06

Launch & improve

Document the solution, train users and agree how changes are handled.
Data technologies & tools

The right tool for your
existing data stack

The right technology depends on your existing systems, data volume, access model, reporting needs and team preferences. We recommend an approach after reviewing the requirement, and we publish only technologies we actively deliver and support.

BI & visualization

Dashboarding and reporting platforms.

Databases & storage

Where data lives and is modelled.

Integration

APIs, connectors and data pipelines.

Languages & automation

Scripts and workflows for repeatable steps.

Data security, privacy & access control

Design access around
who needs to see what

Analytics systems may hold financial, customer, employee or operational information. We agree what data can be accessed, where it may be processed, who can view outputs, how credentials are managed and how long data is retained. Specific controls depend on the engagement.

Role-based access

Least privilege, matched to role requirements.

Secure transfer

Protect data moving between systems.

Credential handling

Agree how credentials are managed.

Retention

Agree how long data is kept.

Use cases

Analytics across
business functions

These are starting points, not claims that every use case is already implemented by IQC. The final scope is tailored to the available data, business rules and decision process.

Sales and pipeline

Lead, opportunity and revenue reporting.

Marketing performance

Campaign, traffic and conversion views.

Finance and operations

Cost, capacity and service-level monitoring.

Customer activity

Engagement and repeat behavior.

E-commerce

Product and order patterns.

Executive KPI reporting

Agreed measures in one view.
Projects & case studies

Data analytics and
BI projects

Each case study explains the business context, challenge, work delivered and what the client could do more clearly afterward. When results can’t be shared we describe verified deliverables, not invented percentages. The cards show formats, not completed projects.
CASE STUDY FORMAT

BI dashboard project

The reporting question, the sources used, the views delivered and how users access or refresh them. Illustrative dashboards use sample data.
CASE STUDY FORMAT

Reporting automation

The former workflow, the steps automated and the validation or exception checks implemented.
CASE STUDY FORMAT

Data integration

The source systems, the approved integration approach and how records or metrics were mapped.
Looking for completed work? Visit our Work page.
FEATURES
Why IQC for analytics

More than charts: data collected,
integrated, protected and used

Analytics often touches software, AI, cloud and development. IQC’s broader capabilities can be relevant when a reporting requirement crosses those boundaries.
01

Start with the question

Understand what decision the data should support.
02

Agree the scope

Sources, metrics, users and refresh needs defined up front.
03

Validate the information

Compare results against known figures before release.
04

Deliver something people use

A solution that fits the problem and your environment.
Ongoing Analytics Support

Keep dashboards and reports working as the business changes

Business reporting changes as tools, KPIs and processes change. Ongoing support can include fixing issues, updating reports, adding a new source, refining metrics, improving performance and helping users understand changes. Coverage, response times and service windows are agreed in advance, and the impact of a source-system change is made clear.
Analytics FAQs

Data analytics & BI
FAQs

Honest answers about what analytics can and can’t do.

We start by discussing the business question, data sources, users and intended output, then define a practical scope.

Potentially, where suitable access, APIs, exports or connectors are available; feasibility is checked during discovery.

Yes. The metrics and calculations should be agreed with the relevant stakeholders before implementation.

Recurring reporting steps may be automated after source data, business rules and exception handling are understood.

Timing depends on data quality, number of sources, integration complexity, validation requirements and scope; a realistic schedule follows discovery.

We can review the current setup and confirm which updates or fixes are feasible once the tools and access requirements are known.

No. Analytics and forecasts depend on data, assumptions and business context; any model should be evaluated against an agreed method.

Let’s make your business
data more useful

Tell us what you need to understand, which systems hold the information and how your team uses reports today. We can help scope a practical next step for analytics, dashboards, data integration or reporting automation.
A clear business question and a basic picture of your data sources are enough to begin. Please don’t send confidential data through this form.
Scroll to Top