Make your business data easier
to understand and use.
Data analytics and business
intelligence solutions
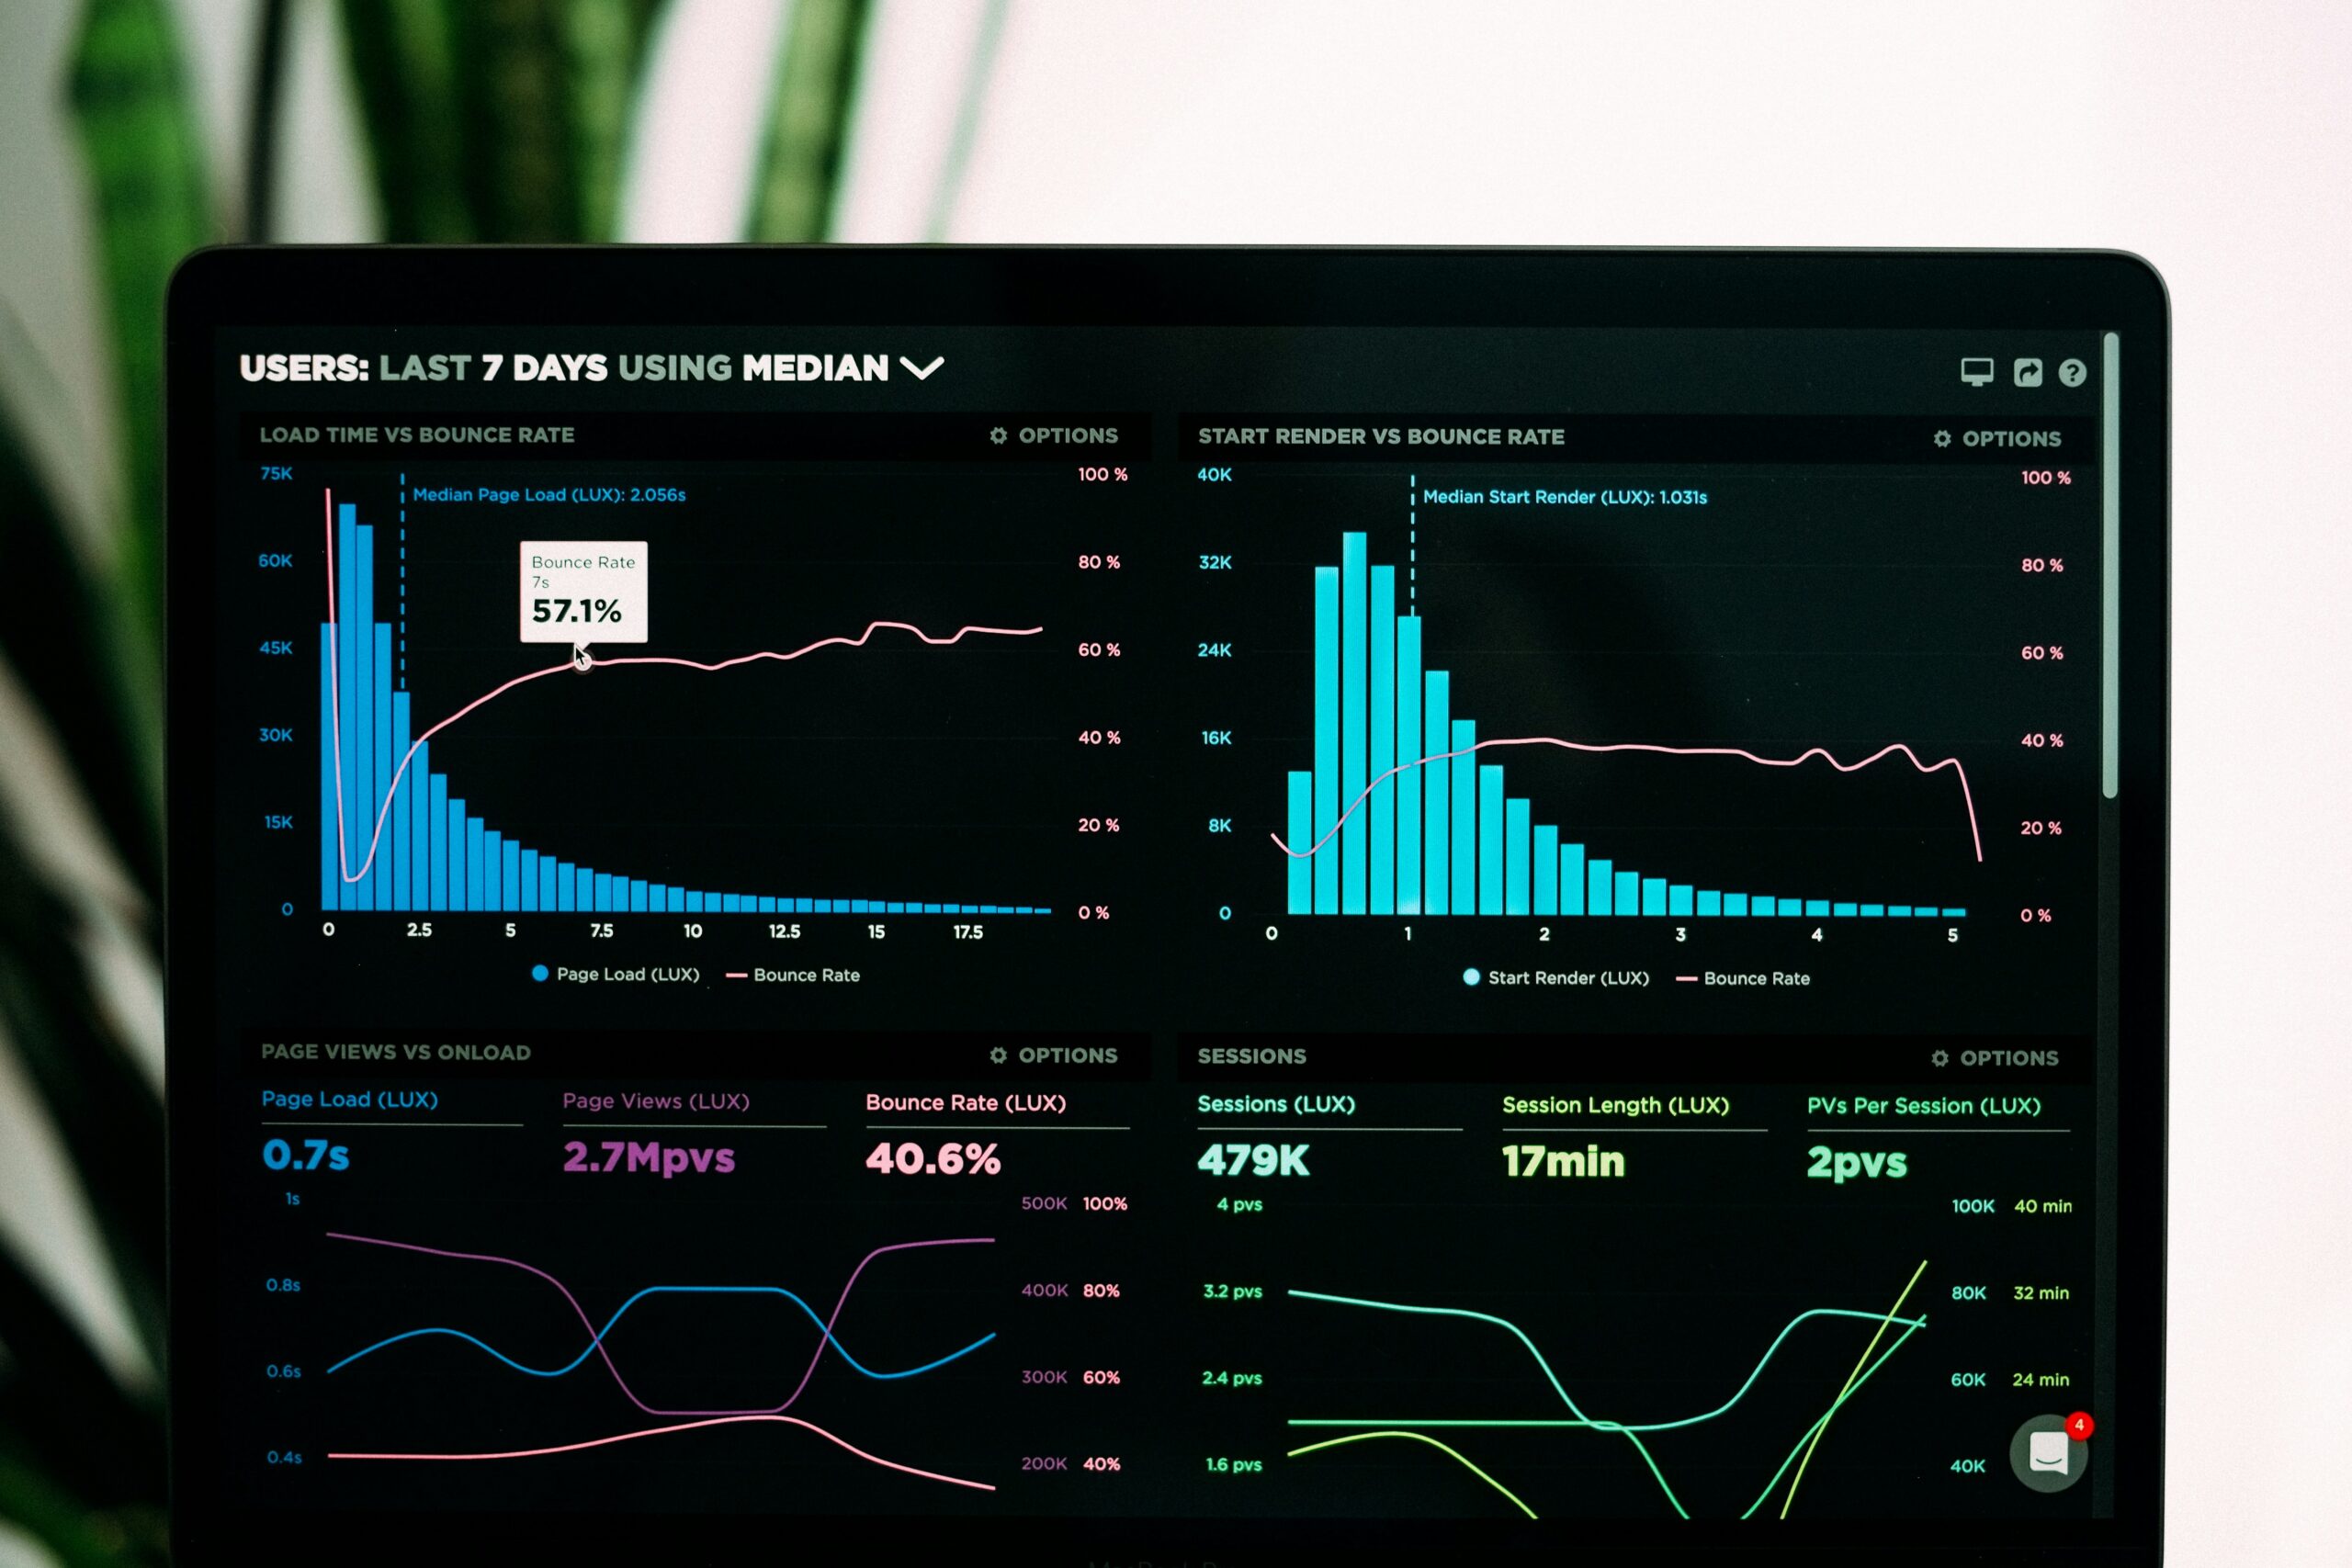
Data analytics for business performance
- Organize relevant datasets
- Define useful measures
- Examine trends across business activity
- Explain what the data can and cannot show
Reporting shaped around the decisions your team makes
- Reporting requirements and metric definitions
- Connected source systems
- Views that support regular reviews


Custom dashboards for the right people
- Metric definitions and sources
- Role-based dashboard design
- Data validation before release
- Refresh frequency, permissions and drill-down planned to scope
Stop rebuilding the same report every week
- Scheduled data pulls
- Defined transformations
- Delivery in an agreed format
- Exception handling and human review
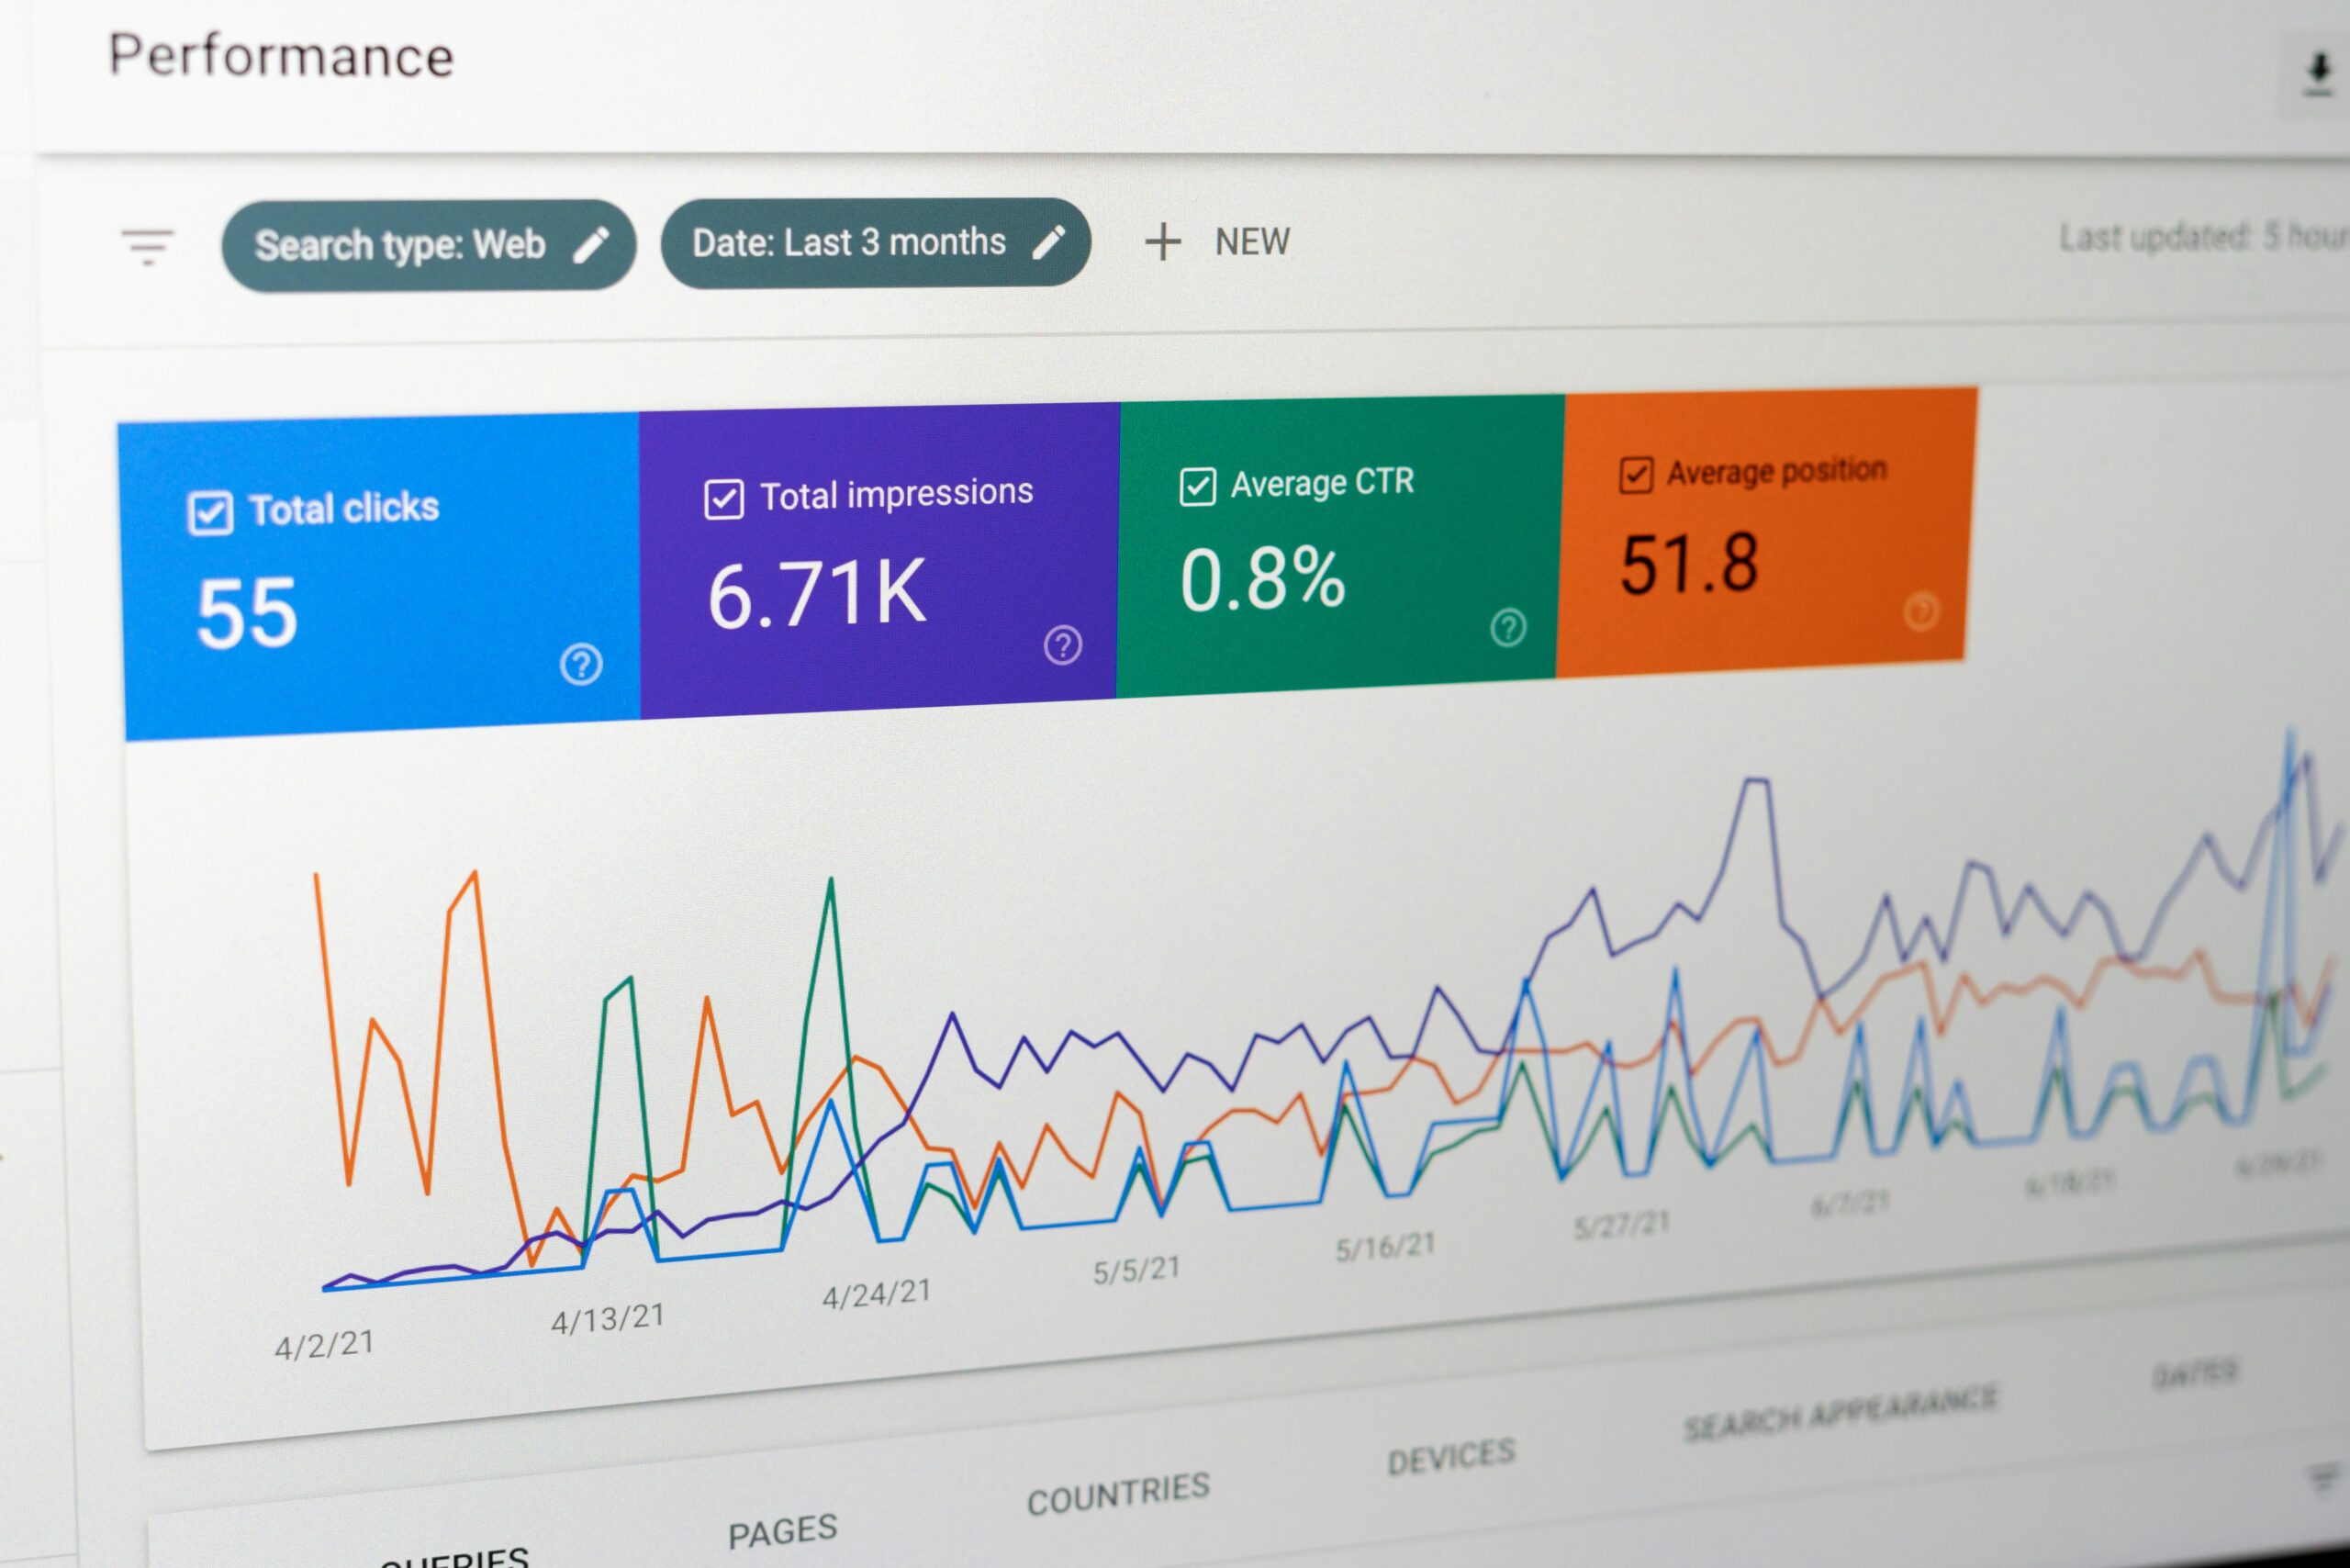
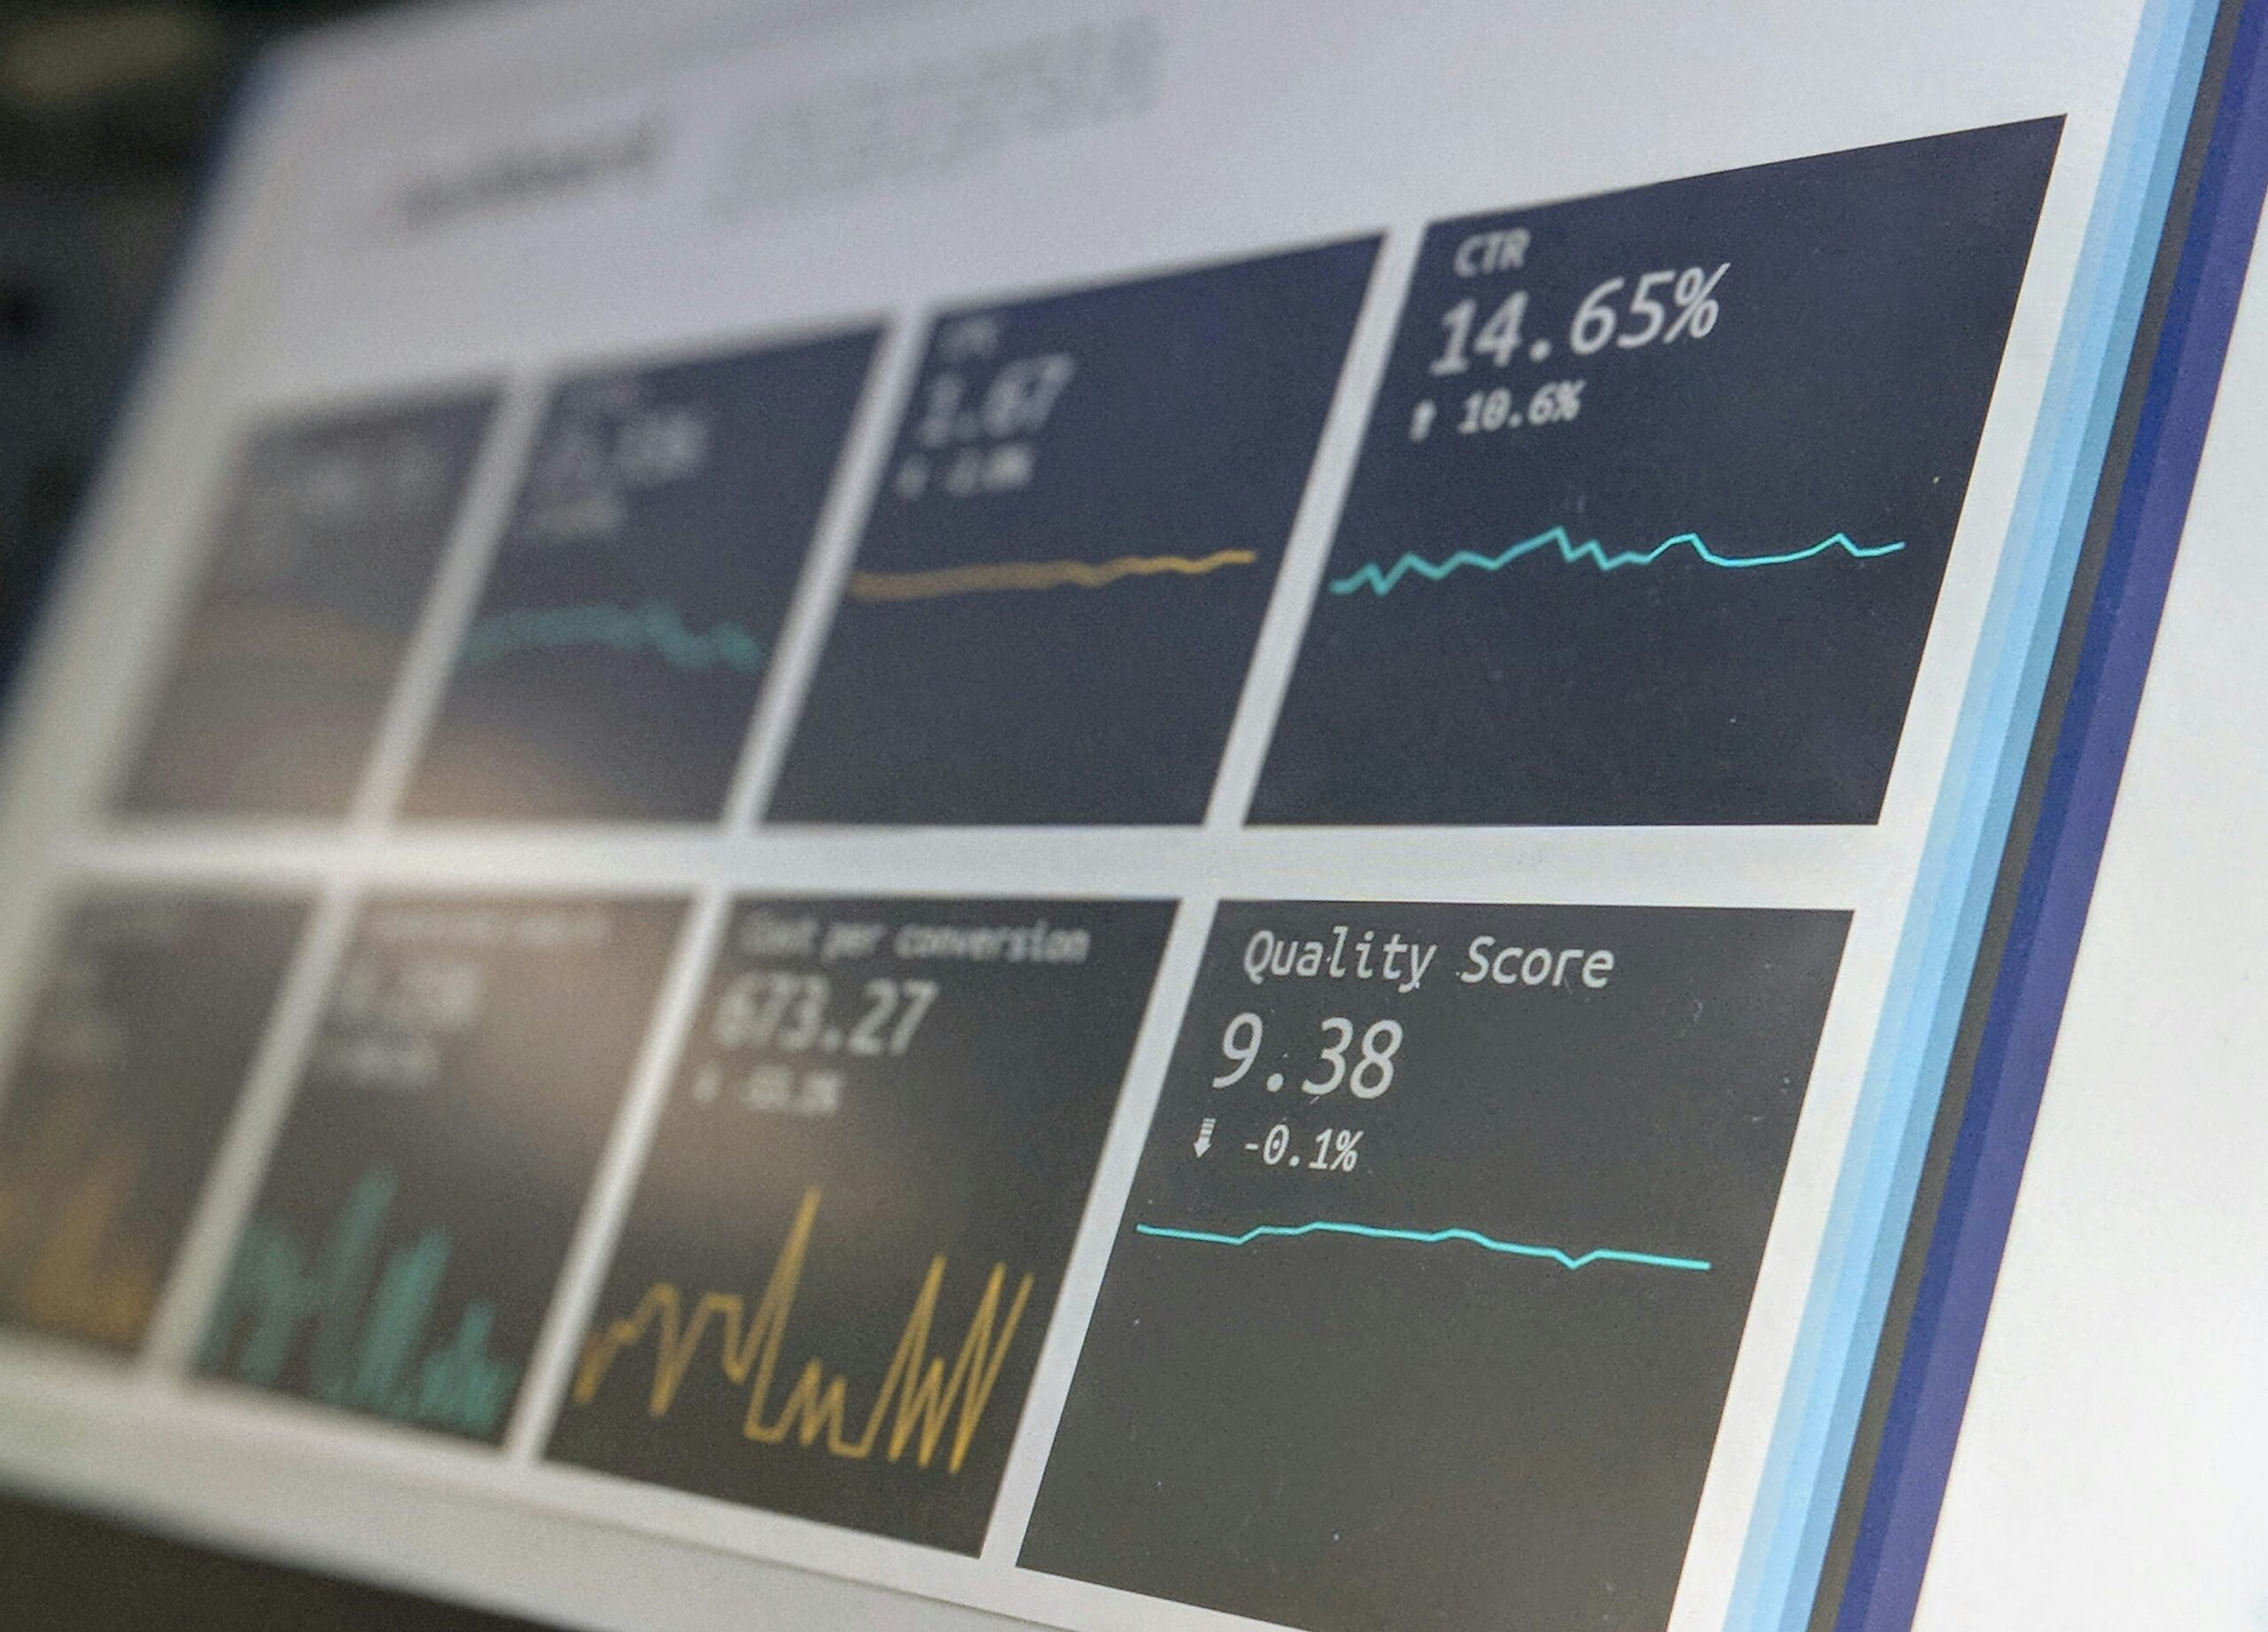
Connect the systems your reports depend on
- Assess APIs, exports, databases and connectors
- Map records between systems
- Plan the update frequency
- Agree the integration approach
Forecasting, with realistic expectations
- Assess data coverage and stability
- Consider seasonality and bias
- Agree how the model is tested
- Monitor over time
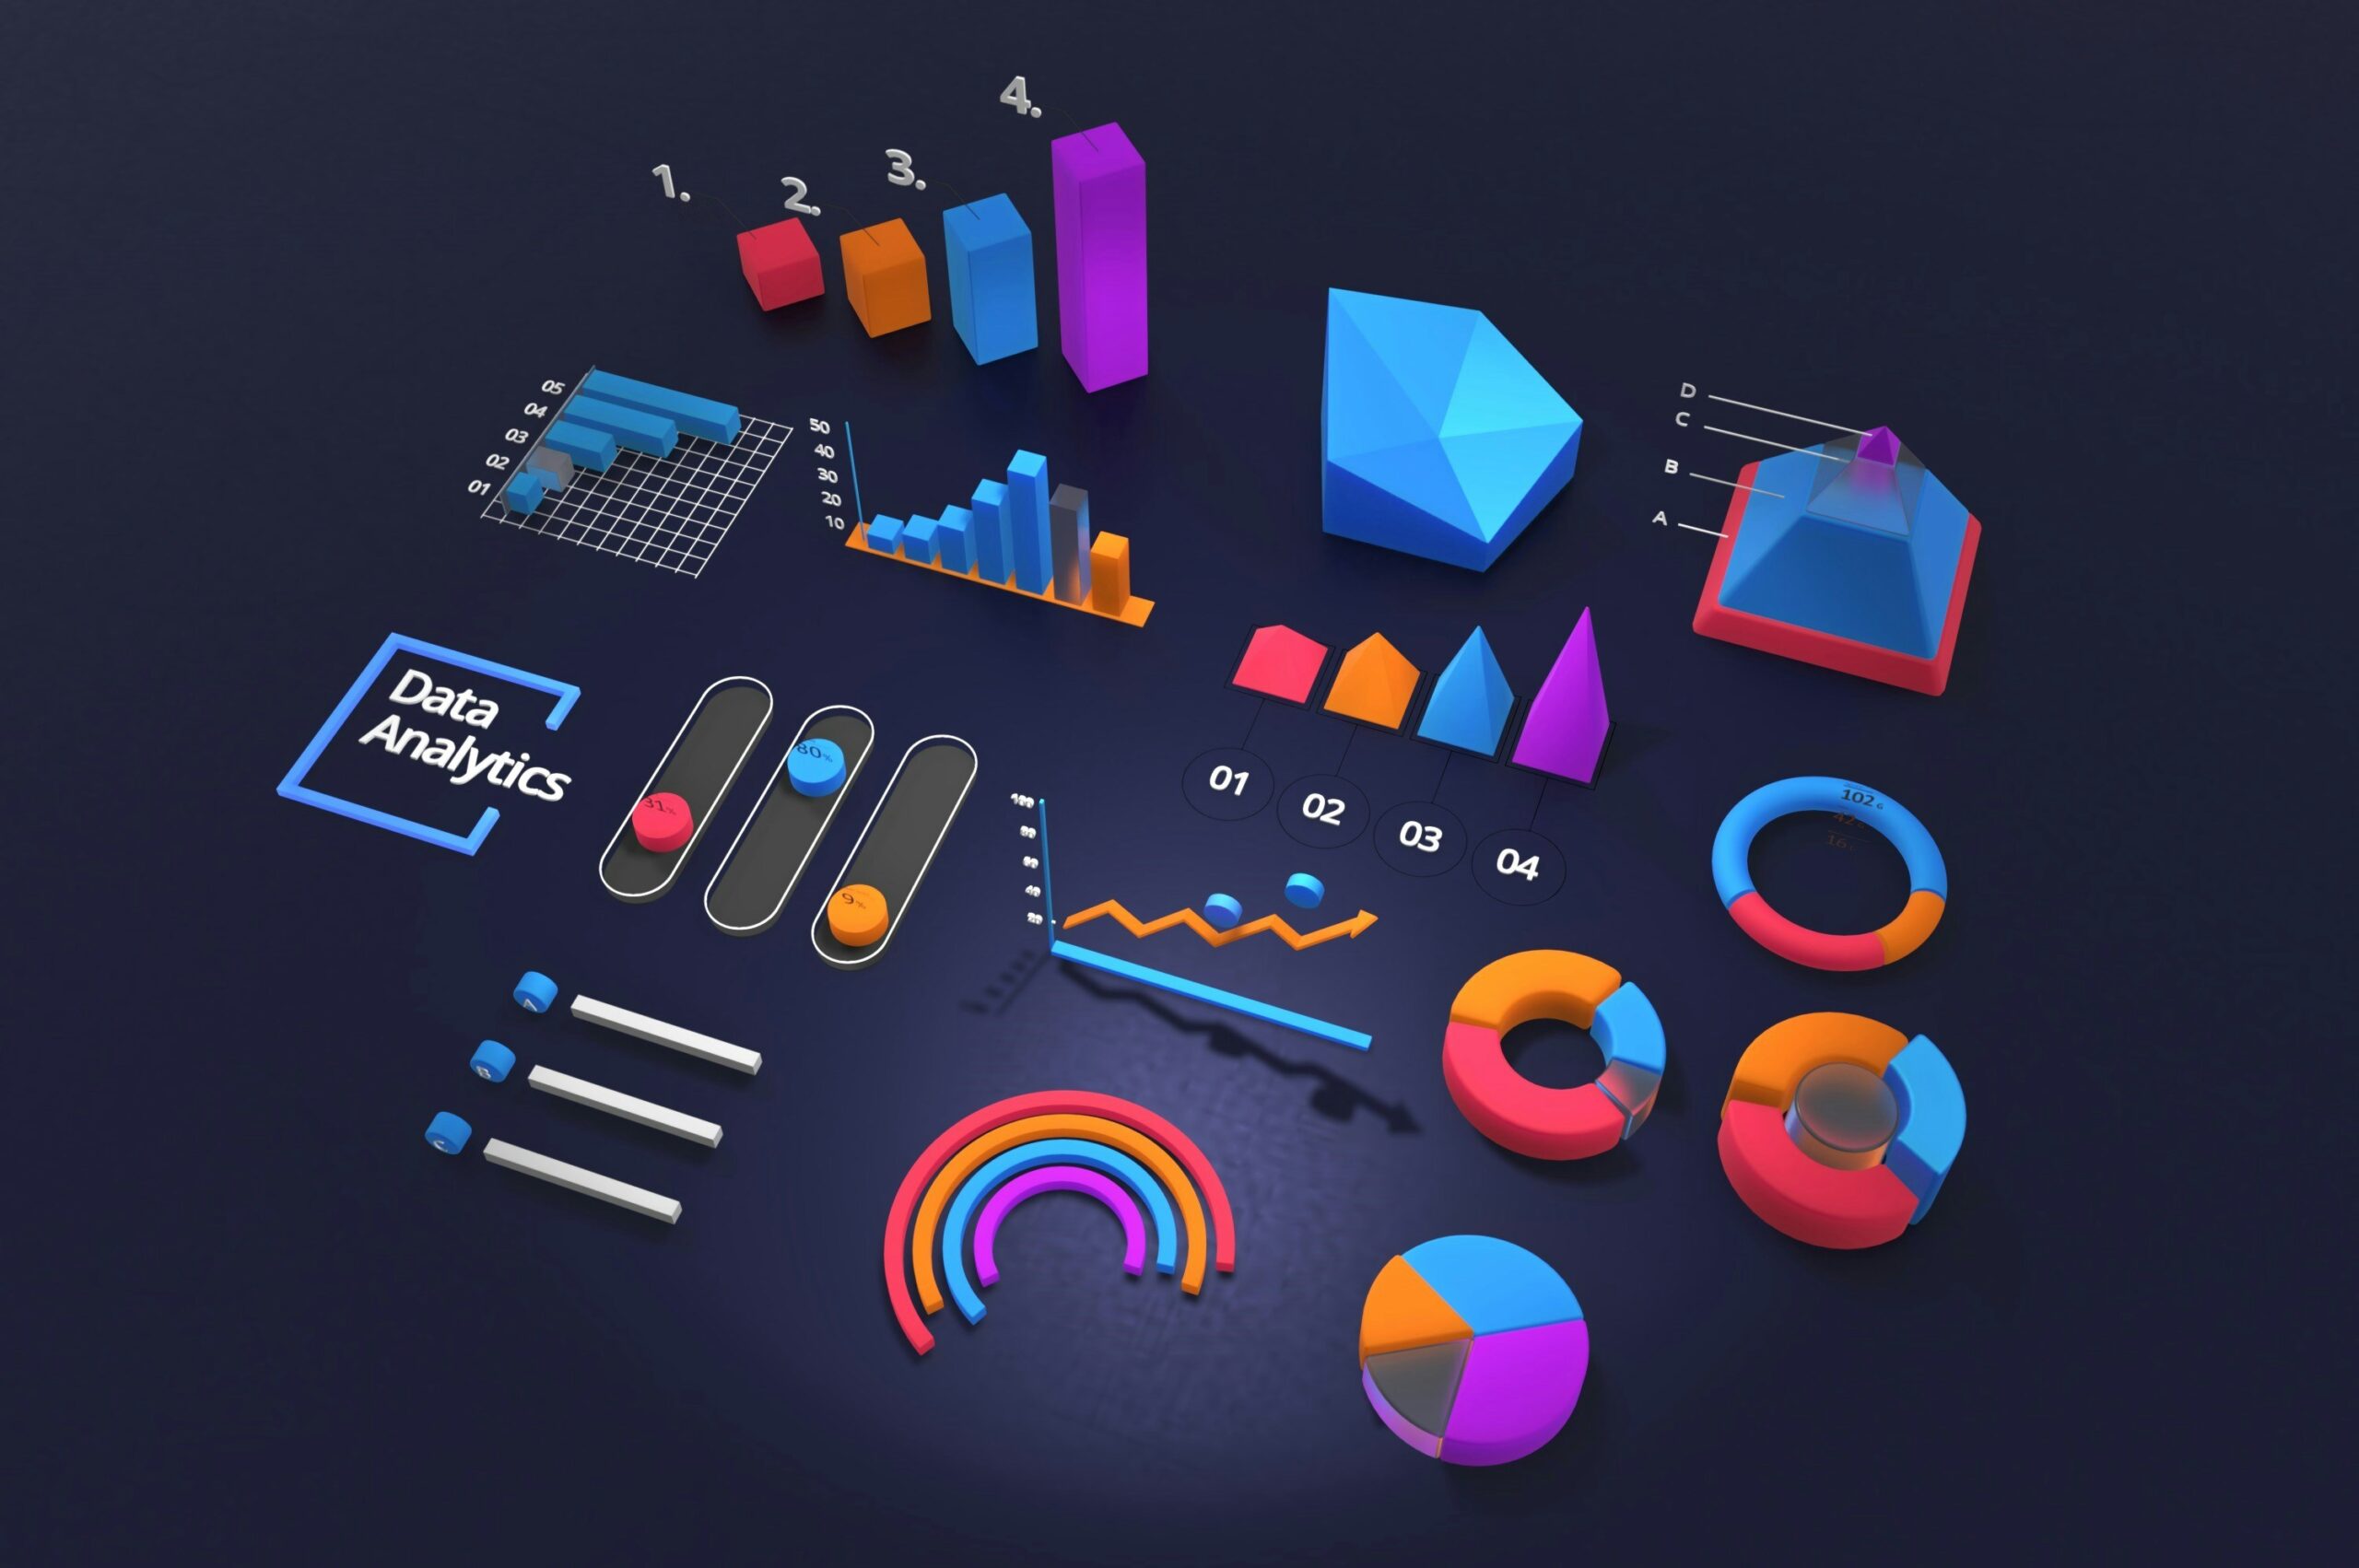
Clear visuals on top of
dependable data
Data Visualization
Choose chart types, organize information and set clear labels so people can interpret the message without decoding the graphic.
Business Reporting
Reports for sales, finance, marketing, operations or management, delivered as dashboards, scheduled summaries or documents, with metric calculations clarified.
Data Management
Map data sources and ownership, document key fields and establish consistent structures and maintenance workflows.
Data Quality & Validation
Document validation rules, compare totals, track issues and make duplicates, gaps and inconsistencies visible.
Data Automation
Automate collection, transformation, checks and distribution, with exceptions surfaced rather than silently passed downstream.
Custom Analytics Solutions
Map the decision, the users, the sources and the constraints, then build integrations, logic and dashboards around that question.
Reporting for the teams
that use it
Sales Analytics
Leads, opportunities, conversion stages, products, accounts and revenue measures, with agreed definitions of a lead, a win and the reporting period.
Marketing Analytics
Campaign, website, advertising and CRM data in one view, with sources, conversions and attribution assumptions stated.
Customer Analytics
Engagement, repeat activity, purchasing patterns and churn indicators, respecting access controls, consent and data minimization.
Financial & Operations Analytics
Costs, budgets, delivery measures, capacity, inventory and service levels from approved source data.
Real-Time & Near-Real-Time
Choose a refresh cadence based on the decision and source systems. We state the actual interval rather than claiming real-time.
Analytics API & System Integration
Move information between analytics tools, business applications, databases and custom software, with monitoring and error handling.
Start with the question
you need to answer
Bring data together
Connect scattered sources into one reporting flow.
Check data quality
Surface missing, duplicate or inconsistent records.
What business data can we
help you analyze?
Sales activity
Pipeline, conversion and revenue measures.
Marketing performance
Campaigns, traffic and enquiries.
Customer engagement
Activity, repeat behavior and groups.
Financial measures
Costs, budgets and trends.
Operations
Delivery, capacity and service levels.
Website activity
Visits, journeys and conversions.
Product usage
How a product or service is used.
Other business datasets
Tell us what you have and what you need to understand.
Our data analytics
and BI process
Define the question
Assess the data
Design
Build & validate
Review with users
Launch & improve
The right tool for your
existing data stack
BI & visualization
Dashboarding and reporting platforms.
Databases & storage
Where data lives and is modelled.
Integration
APIs, connectors and data pipelines.
Languages & automation
Scripts and workflows for repeatable steps.
Design access around
who needs to see what
Role-based access
Least privilege, matched to role requirements.
Secure transfer
Protect data moving between systems.
Credential handling
Agree how credentials are managed.
Retention
Agree how long data is kept.
Analytics across
business functions
Sales and pipeline
Marketing performance
Finance and operations
Customer activity
E-commerce
Executive KPI reporting
Data analytics and
BI projects
BI dashboard project
Reporting automation
Data integration
More than charts: data collected,
integrated, protected and used
Start with the question
Agree the scope
Validate the information
Deliver something people use

Keep dashboards and reports working as the business changes
- Fixing issues
- Updating reports and adding sources
- Refining metrics
- Performance improvements
- Helping users understand changes
Data analytics & BI
FAQs
How does a data analytics project begin?
We start by discussing the business question, data sources, users and intended output, then define a practical scope.
Can you connect data from multiple systems?
Potentially, where suitable access, APIs, exports or connectors are available; feasibility is checked during discovery.
Can you build dashboards around our KPIs?
Yes. The metrics and calculations should be agreed with the relevant stakeholders before implementation.
Can reports be automated?
Recurring reporting steps may be automated after source data, business rules and exception handling are understood.
How long does a project take?
Timing depends on data quality, number of sources, integration complexity, validation requirements and scope; a realistic schedule follows discovery.
Do you support existing dashboards?
We can review the current setup and confirm which updates or fixes are feasible once the tools and access requirements are known.
Can you guarantee forecast accuracy or business results?
No. Analytics and forecasts depend on data, assumptions and business context; any model should be evaluated against an agreed method.